Two watchdogs, two jobs: external uptime and internal metrics
UptimeRobot for external uptime checks, Netdata Cloud for internal resource monitoring. Why you need both, what each catches, and where competitors fit.

Most monitoring failures fall into one of two categories: the server died and nobody got paged, or the server was slowly dying for hours before anyone noticed. These are opposite problems requiring different solutions.
This post covers a deliberately simple stack: UptimeRobot for external uptime monitoring, Netdata Cloud for internal resource monitoring. I'll explain why each tool fits its job, what real-world failure modes look like, and where competitors make sense instead.
Why you need two kinds of monitoring
The failure modes are structural opposites.
When a machine goes offline — power loss, kernel panic, hypervisor issue, ISP outage — it cannot send you an alert. The monitoring system itself is the thing that's broken. Uptime monitoring must live outside your infrastructure. The checker and the alert pipeline have to be unaffected by whatever took your service down.
When a machine stays online but degrades — disk filling, memory pressure, a runaway process, a dying SD card — you want early warnings before it tips over. That requires high-resolution, always-on visibility into the internals of the server itself.
Neither tool substitutes for the other. A synthetic uptime check tells you "it's broken from the outside, right now." Internal resource monitoring tells you "it's about to break, here's why." You need both signals.
External monitoring: UptimeRobot
What external monitoring actually does
External monitoring is synthetic: a third-party service checks your endpoints at a fixed interval from outside your network and alerts you on failure. Checks range from basic (TCP port open, ICMP ping) to closer to real user experience (HTTPS with keyword matching, DNS resolution, SSL expiry).
Three reasons this has to be external:
- A down server can't send alerts. A down network can't deliver them. The check source must be independent of your failure domain.
- Many failures are invisible from inside your LAN — misconfigured DNS, a broken reverse proxy rule, a firewall change, CDN issues. External checks see your service the way real users do.
- Alert delivery needs its own reliability. If your paging path runs through your infrastructure, it fails precisely when you need it.
What to monitor for a typical self-hosted service
A practical baseline:
- HTTPS GET to your public URL, or a dedicated
/healthzendpoint that confirms the app is actually running — not just that nginx is answering. - TCP port checks for anything that doesn't speak HTTP. Custom service ports, SSH if you care about remote access availability.
- Keyword checks for a string that only appears when the application is fully functional. "Sign in" on a login page, a specific API response field. This catches cases where the server returns 200 but the app is broken.
- DNS checks to detect accidental misconfigurations or propagation surprises.
- SSL and domain expiry — preventable failures with severe consequences. Monitor them.
External monitoring answers one question: "Is it broken, from the outside, right now?" Root cause investigation is a different job.
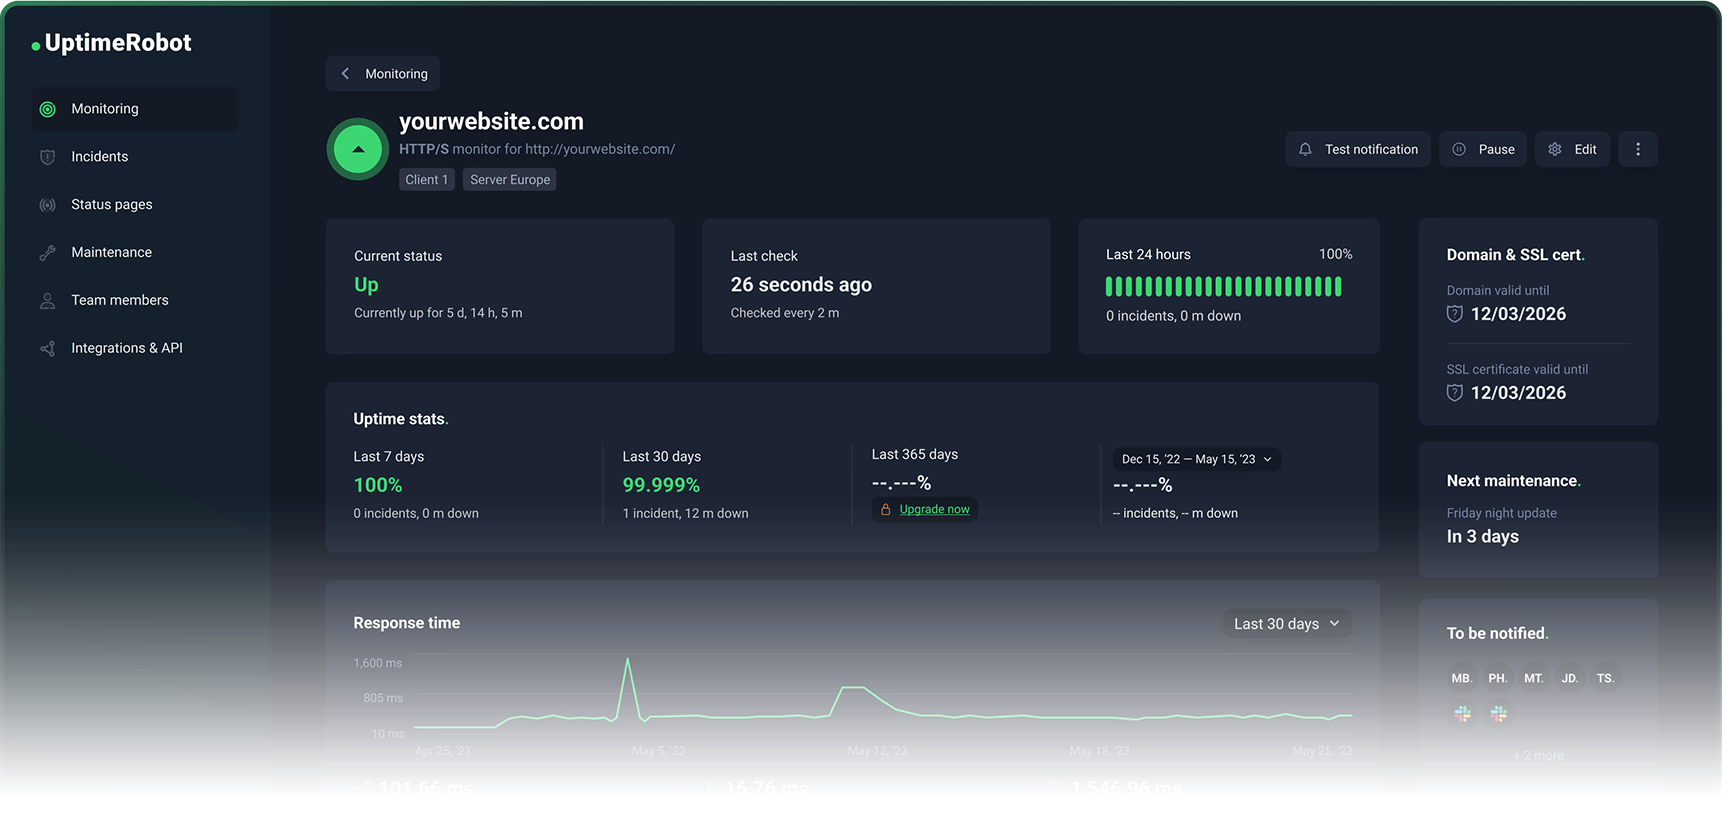
Why UptimeRobot is the default recommendation
UptimeRobot's free plan includes 50 monitors at 5-minute intervals with support for HTTP, port, ping, and keyword check types. That covers the needs of most personal projects and small businesses without spending anything.
The upgrade path is sensible rather than punitive:
- Solo plan: 60-second check intervals, SSL and domain expiry monitoring included.
- Higher tiers: 30-second intervals on Enterprise, more monitors, richer integrations, full status page functionality (check out our own status page!)
- Add-ons: SMS and voice call alerting via credit packs for when email and push aren't enough.
- Mobile apps: first-class, with widgets and on-device push alerts.
UptimeRobot stays focused. It does uptime monitoring. It doesn't try to become your incident management platform or your observability suite. You set it up in 20 minutes, forget about it, and actually get paged when something breaks.
Where competitors make sense
Better Stack (Better Uptime) is worth considering if you want richer incident management integrated with uptime monitoring. Its free tier includes 10 monitors and a status page. Paid plans add 30-second checks, traceroute/MTR diagnostics, and screenshots. The trade-off: broader platform, more complexity, different pricing structure.
StatusCake has a legitimate free tier and paid plans priced in EUR. The free tier includes 10 uptime monitors at 5-minute intervals. A real alternative, but its free tier is materially smaller than UptimeRobot's 50 monitors — often the difference between monitoring everything important and picking only a few things.
Checkly is excellent for engineering teams who want synthetic monitoring as code, including Playwright-based browser checks. Optimised for transactions, traces, and CI-style workflows. If you just need endpoints watched, it's more tool than you need.
Pingdom is a long-standing product with uptime monitoring, transaction monitoring, and SMS alerting. It prominently offers a free trial rather than a permanent free tier, which puts you on an enterprise-leaning paid trajectory.
UptimeRobot wins for self-hosters and small teams because the free plan is large enough to cover real needs, the upgrade path is straightforward, and it stays focused on the uptime problem.
Internal monitoring: Netdata Cloud
What internal monitoring needs to catch
Most self-hosted outages aren't dramatic. They're slow, boring failures that look fine until the moment they don't:
- Disk fills up: databases stop writing, Docker pulls fail, logs can't append, the OS can become unstable.
- Memory pressure: the system thrashes, latency spikes, and eventually the Linux OOM killer starts terminating processes. From the outside this looks like "my app randomly restarted."
- CPU saturation: everything technically works, but response times climb until timeouts trigger downstream failures.
- I/O bottlenecks: databases and containers get slow, watchdogs restart services, hiding the real cause.
- Flash wear on Raspberry Pi: SD cards have finite write endurance. A growing database degrades performance and longevity. Home Assistant users know this problem well.
On modern Linux systems, systemd-oomd can act before the kernel OOM by monitoring cgroup pressure stall information and taking corrective action. Useful, but it reinforces the core point: memory pressure is a detectable phase. You can alert on it before processes start dying.
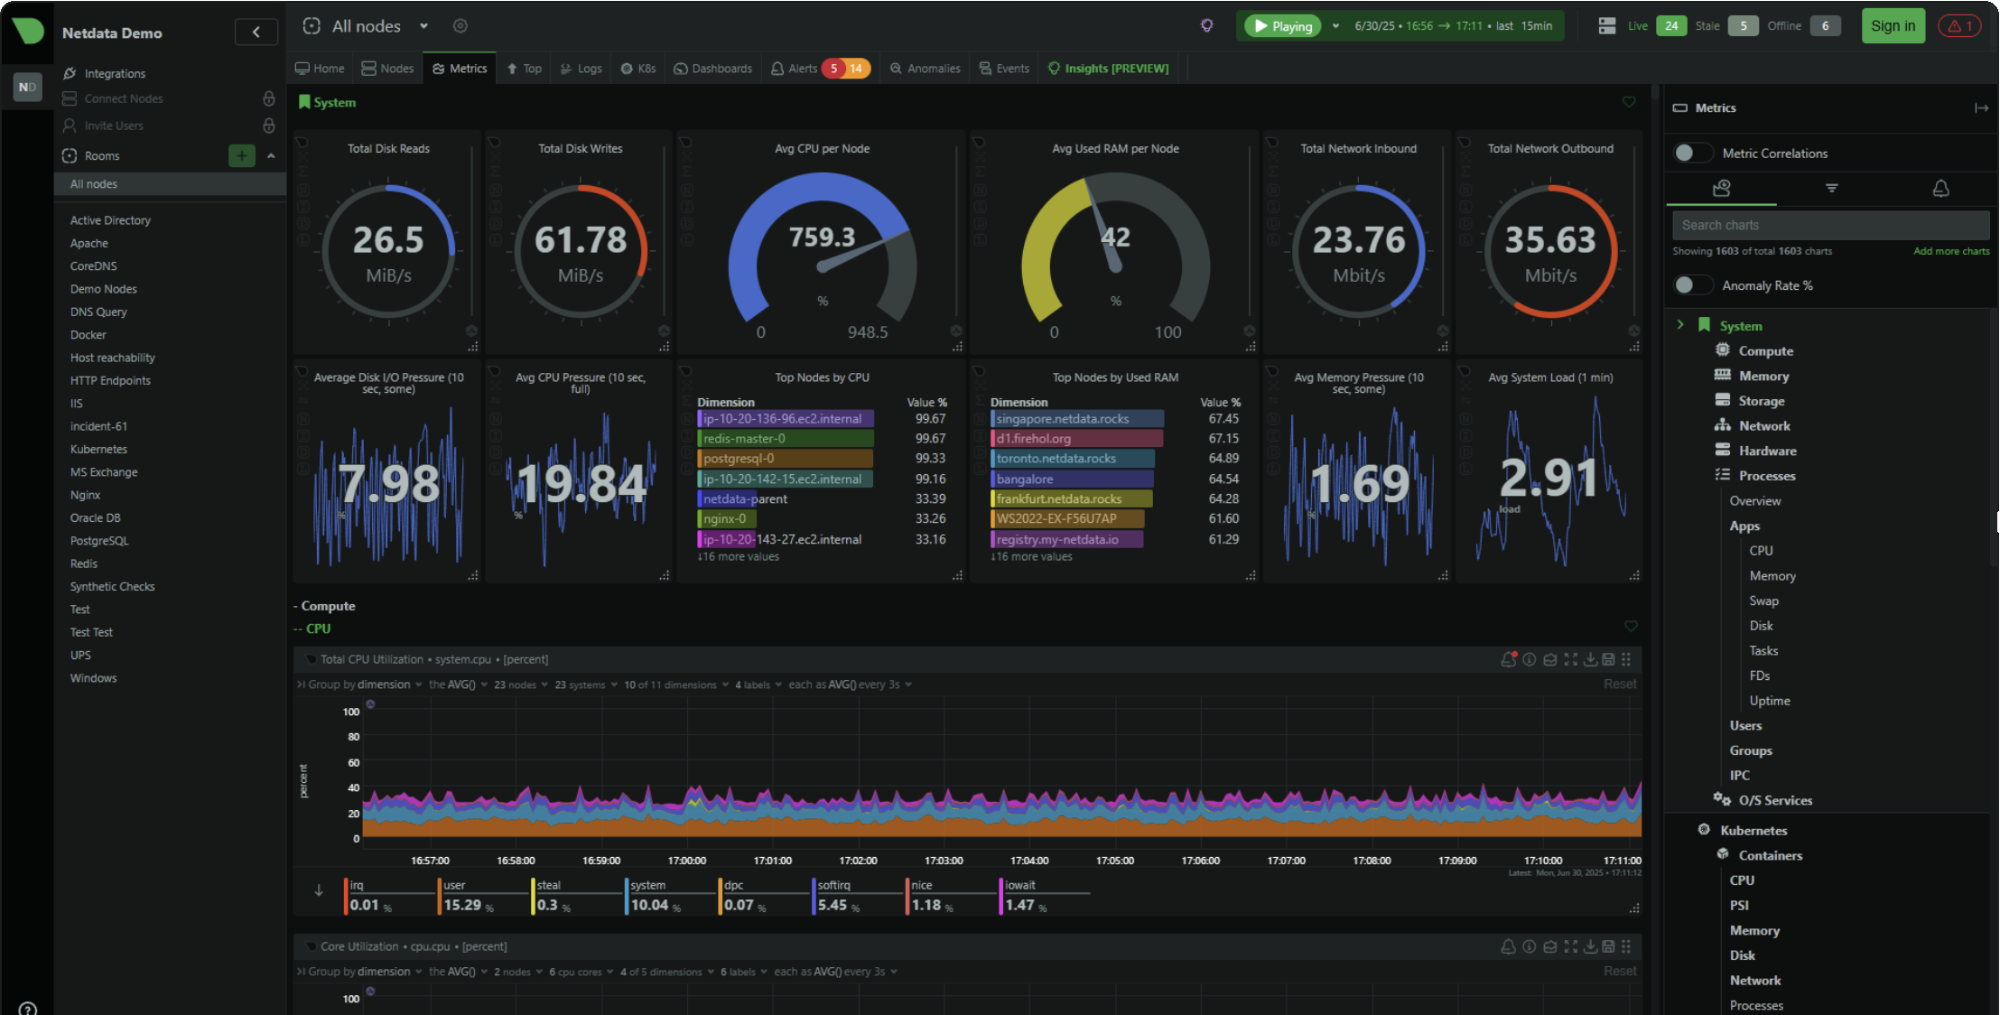
Why Netdata Cloud is the right default
Netdata Cloud's core value is high-resolution dashboards that work immediately after installation. Per-second metrics, charts designed for troubleshooting, and a kickstart installer that gets you running with a single command:
wget -O /tmp/netdata-kickstart.sh https://get.netdata.cloud/kickstart.sh && sh /tmp/netdata-kickstart.sh
Two architectural details matter for self-hosters:
Data locality. Your metrics stay on your infrastructure. The cloud layer provides remote access and central views — it doesn't pull your data into a third-party warehouse. Netdata's own documentation states "your data stays on-premises; only views stream to the cloud." For anyone running sensitive workloads or subject to data residency requirements, this matters.
Useful from day one on a single node. Unlike a Prometheus + Grafana stack — where the heavy lifting is configuring storage, writing dashboards, and wiring up alerting — Netdata's agent is designed to be immediately useful on a single machine. Dashboards, collection, and alerting are built in.
The free tier (Community) supports up to 5 connected nodes with limited custom dashboards. For a homelab, a few VPS instances, or a small business with a handful of servers, that covers real needs.
The Business tier at $4.50/node/month (billed annually) adds unlimited dashboards and retention, RBAC and SSO, centralised configuration, enterprise notification integrations, and audit logs. Paid features are tied to operational scale and team requirements, not arbitrary paywalls.
Where competitors make sense
Datadog is the right choice when you want a single vendor for infrastructure, APM, logs, synthetics, and security. Its free tier covers up to 5 hosts with 1-day metric retention. For a Raspberry Pi or two VPS instances, it's overkill.
Grafana Cloud has a genuinely useful free tier (10k active metric series, 14-day retention) and pay-as-you-go pricing beyond that. Great option if you already speak Prometheus and want a managed backend. The trade-off: you're responsible for building and maintaining dashboards, alert rules, and instrumentation.
New Relic shines for deep application telemetry with a unified data model across logs, metrics, traces, and events. Its free tier includes 100 GB data ingest and one full platform user. More "observability platform" than "headless server health monitor."
Nagios Core and Zabbix remain widely deployed. Both are capable. Both demand significant configuration and ongoing care.
Netdata wins for internal monitoring of headless servers because it delivers immediate, high-resolution visibility with minimal setup, keeps data on your infrastructure, and scales to team features with predictable per-node pricing.
Why self-hosting your monitoring is usually a bad deal
The question isn't capability. It's operational burden versus benefit.
External monitoring: the clearest "don't self-host" case
Uptime Kuma is polished and supports many monitor types and notifications. I like it. But self-hosting Uptime Kuma reintroduces exactly what you were trying to avoid: you need to run it somewhere that stays reachable when your primary environment is down, keep it backed up and updated, and maintain the alerting pipeline separately.
To do external monitoring properly with a self-hosted tool, you need multiple geographically diverse check locations, a reliable alerting pipeline that survives your infrastructure going offline, noise control (retries, confirmation checks, maintenance windows), and escalation management for teams.
UptimeRobot's free plan already covers 50 monitors. When you pay, you're buying the operational reliability of the monitoring platform itself, not just more checks. The economics rarely favour self-hosting.
Internal monitoring: the stack tax is real
A classic self-hosted internal stack is Prometheus for metrics storage and alerting, plus Grafana for dashboards. Great choice at scale or when you need deep integration with an existing observability platform. Also the fastest way to become your own monitoring vendor.
The stack tax is the ongoing cost of maintaining that infrastructure: storage configuration, dashboard maintenance, alerting rules, upgrades, and debugging why your monitoring broke while you were trying to debug something else.
Netdata avoids this for individuals and small teams because dashboards, collection, and alerting work out of the box. The SaaS layer is optional.
The pattern that holds in practice: use free managed tiers when your goal is reliable monitoring with minimal work. Pay for managed monitoring when you need shorter intervals, more endpoints, team features, and alerting sophistication. Don't self-host the moment monitoring becomes complex and critical — at that point you want vendor support, predictable upgrades, and a guarantee that monitoring stays up even when you're down.
Real failures that show why this matters
External monitoring catches failures invisible from inside
In February 2026, Cloudflare published a postmortem describing an outage where certain customers' routes were withdrawn via BGP after a change to how BYOIP addresses were managed. From the inside, servers were operational. From the internet, unreachable.
In October 2021, Meta's DNS servers became unreachable to the rest of the internet due to routing changes — even though the servers themselves were still running. Meta's services were "up" and simultaneously effectively down to every user on earth.
Both are failures your own servers cannot detect from inside. External checks catch reality.
An AWS us-east-1 disruption in October 2025 cascaded from a latent defect in DynamoDB's automated DNS management into broader service impacts including EC2 launch failures. Multi-location external checks help you distinguish "my ISP is broken" from "AWS is having a bad day" from "my service is genuinely unreachable."
Internal monitoring catches slow failures before they become outages
Clerk's February 2026 postmortem is a textbook example: an inefficient database query plan caused severe degradation, but their failover didn't trigger because the database was technically online. Requests queued, 429s propagated, and the service was functionally down while all the "is it up?" checks returned green.
Clerk explicitly called out "alerting improvements" to detect query plan changes earlier. The meta-lesson: alerts that trigger only on complete outages arrive late. Alerts based on leading indicators — latency climbing, CPU saturation, queue depth growing, disk usage trending toward full — keep "degraded" from becoming "dead."
On smaller setups: Home Assistant users regularly discuss database growth on Raspberry Pi systems, noting that flash memory has finite write endurance. Internal monitoring that trends disk usage and I/O rate, alerting at 80% capacity rather than 100%, prevents the surprise 2 a.m. outage when the SD card fills and everything stops writing.
The "certificate expired" class of outage — Microsoft Teams suffered one, it's well documented — is entirely preventable. SSL and domain expiry monitoring is one of the highest ROI checks you can enable precisely because the failure is predictable and the cost of prevention is near zero.
The stack in practice
For most personal projects and small businesses:
UptimeRobot free plan: HTTPS check to your public URL, keyword check confirming the app is functional, TCP port check for any non-HTTP services, SSL expiry monitoring. Five minutes to configure. Done.
Netdata Cloud Community tier: Install the agent on each server with the kickstart script. Connect to Netdata Cloud for remote access. Set alerts on disk usage (warn at 80%, critical at 90%), memory pressure, and CPU saturation. Done.
Total setup time: under an hour. Ongoing maintenance: near zero. Coverage: the two most important failure modes, handled correctly.
When you grow past five nodes, or need 60-second check intervals, or need team alerting features — the upgrade paths are clear and the costs are predictable. That's the right time to pay, not before.
Where to run this
You need the servers being monitored to exist somewhere. Hetzner gets you a CX22 at €4.85/month with €10 in starting credit — it's what this blog runs on and a solid base for anything you'd point UptimeRobot and Netdata at. Vultr is worth a look if you want more regions or a different provider in the mix — $35 referral credit to start.
If you're running OpenClaw or AI agent workloads and don't want to manage the infrastructure yourself, xCloud handles the hosting so you can focus on the model layer instead of the ops layer.
(Affiliate links — I get a small cut if you sign up, at no cost to you.)